Stock Price Candlestick
What is a Stock Price Candlestick
-
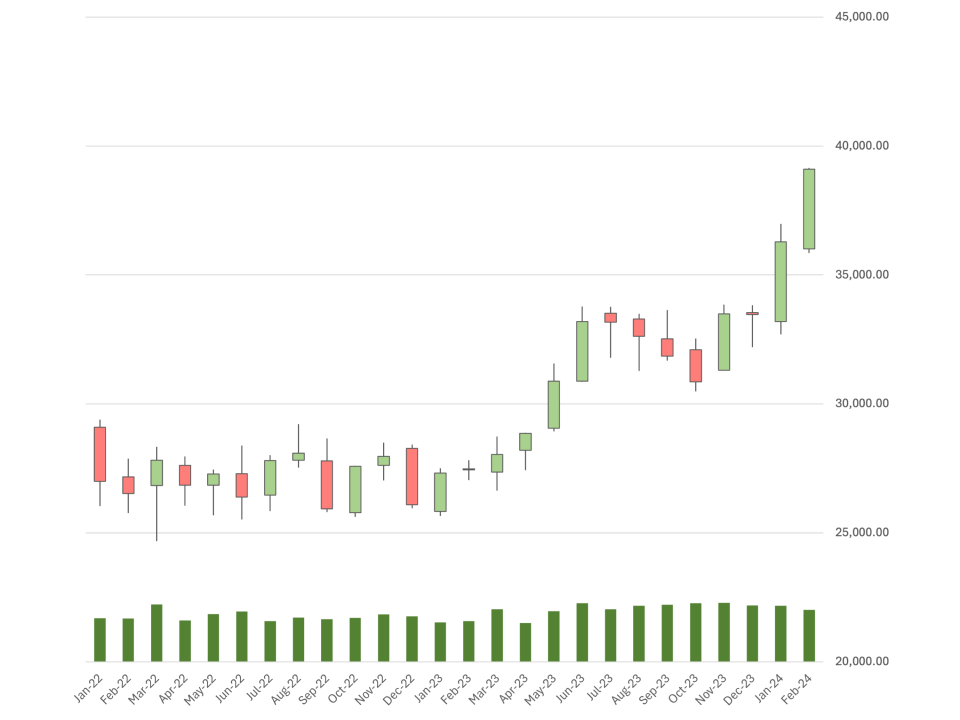
A stock price candlestick, often referred to as a candlestick chart, is a type of financial chart used to represent the price movements of securities. It displays the opening, closing, high, and low prices of a security for a particular time period. Each candlestick consists of a body that represents the difference between the opening and closing prices, and wicks (or shadows) that represent the range between the highest and lowest prices. If the closing price is higher than the opening price, the body is typically colored green or white, indicating a price increase. Conversely, if the closing price is lower, the body is colored red or black, indicating a price decrease.
-
Candlestick charts differ from other financial charts, such as line or bar charts, by providing more detailed information about price action within a specified time frame. Their unique feature is the ability to visually convey market sentiment through the shape and color of the candlesticks, offering insights into potential price trends and market reversals.
Applications of Stock Price Candlesticks
Technical Analysis in Trading
- Stock price candlesticks are primarily used for technical analysis in trading. They help traders identify patterns that signal potential price movements. For example, a “hammer” candlestick pattern might indicate a potential reversal in a downtrend, suggesting a possible buying opportunity.
Trend Analysis
- Traders use candlestick charts to analyze trends over different time frames. For instance, a trader might analyze a series of weekly candlesticks to identify long-term trends, while also using daily candlesticks for short-term market movements. This multi-timeframe analysis helps traders understand both the broader market trends and finer market movements.
Identifying Market Sentiment
- Candlestick charts offer insights into market sentiment. For instance, if a stock shows a series of green candlesticks with long bodies, it indicates strong buying sentiment. Conversely, consecutive red candlesticks with long bodies could suggest a bearish market sentiment.
Setting Stop-Loss and Take-Profit Levels
- Candlestick charts assist traders in setting stop-loss and take-profit levels based on price action. For example, a trader may place a stop-loss just below the low of a “bullish engulfing” pattern, expecting the price to rise, and a take-profit level at the previous resistance.
Stock price candlesticks are essential tools for traders and investors who rely on technical analysis to make informed trading decisions. They provide insights into price trends, market sentiment, and potential trading opportunities.