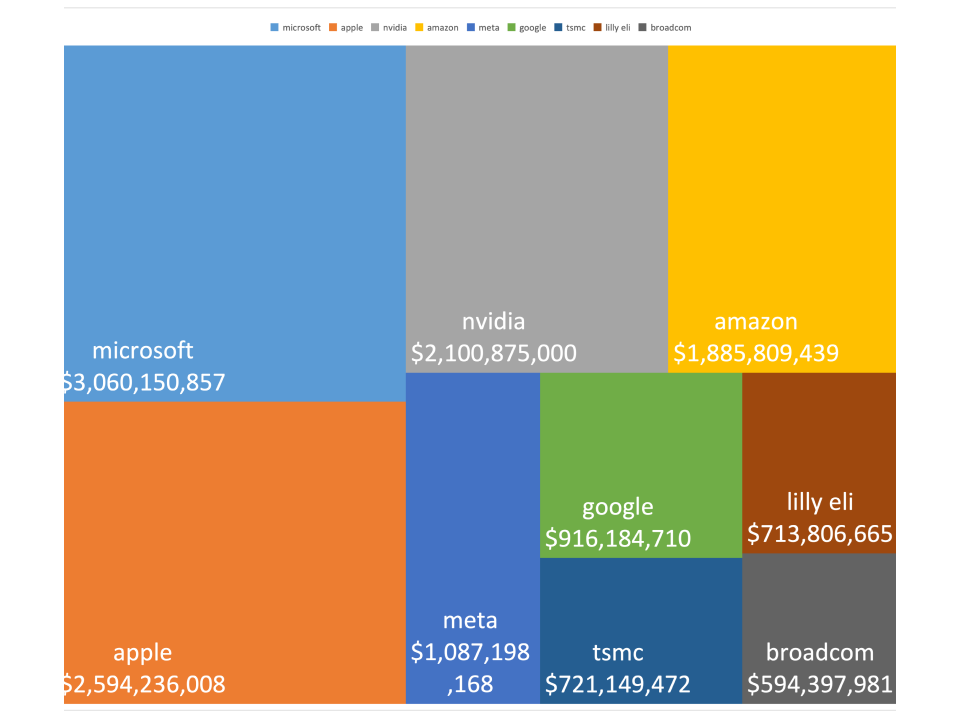
Treemap
What is a Treemap
-
A treemap is a data visualization tool that uses nested rectangles to represent hierarchical data. Each rectangle represents a category, with the size of the rectangle proportionate to the data value it represents. Categories can be further divided into subcategories, with each subcategory being represented as a smaller rectangle within the larger rectangle. This layout provides a visual overview of the structure and relative size of each category in the dataset.
-
The primary difference between a treemap and other charts, like pie charts or bar charts, is its ability to represent hierarchical relationships and large datasets in a compact space. Its unique feature is the ability to display the relative proportions of different categories and subcategories within a dataset, making it easier to identify patterns and relationships that might not be obvious in traditional charts.
Applications of Treemaps
Market Share Analysis
- Treemaps are often used for market share analysis to visualize the market distribution across different companies or products. For example, a treemap can represent the market share of various smartphone manufacturers, with each rectangle showing the proportion of the total market that each brand holds.
Budget Allocation
- In financial analysis, treemaps can visualize budget allocations across departments or projects. For instance, a company might use a treemap to show the budget distribution across departments, with each department further broken down into specific projects or expense categories.
Website Traffic Analysis
- Treemaps can help analyze website traffic by representing the distribution of page views or visitor segments. For example, a website manager can use a treemap to visualize traffic sources, showing the proportion of visitors from search engines, social media, and direct traffic.
File System Analysis
- Treemaps are used to analyze file systems by representing the space used by different files and folders. For instance, a system administrator might use a treemap to identify which directories and file types consume the most disk space, helping optimize storage usage.
Treemaps are powerful tools for visualizing hierarchical data, making them invaluable for market share analysis, budget allocation, website traffic analysis, and file system analysis. Their ability to compactly display large datasets provides valuable insights into data relationships and distributions.
