Balance Sheet
What is a Balance Sheet (Stacked Bar Chart)
-
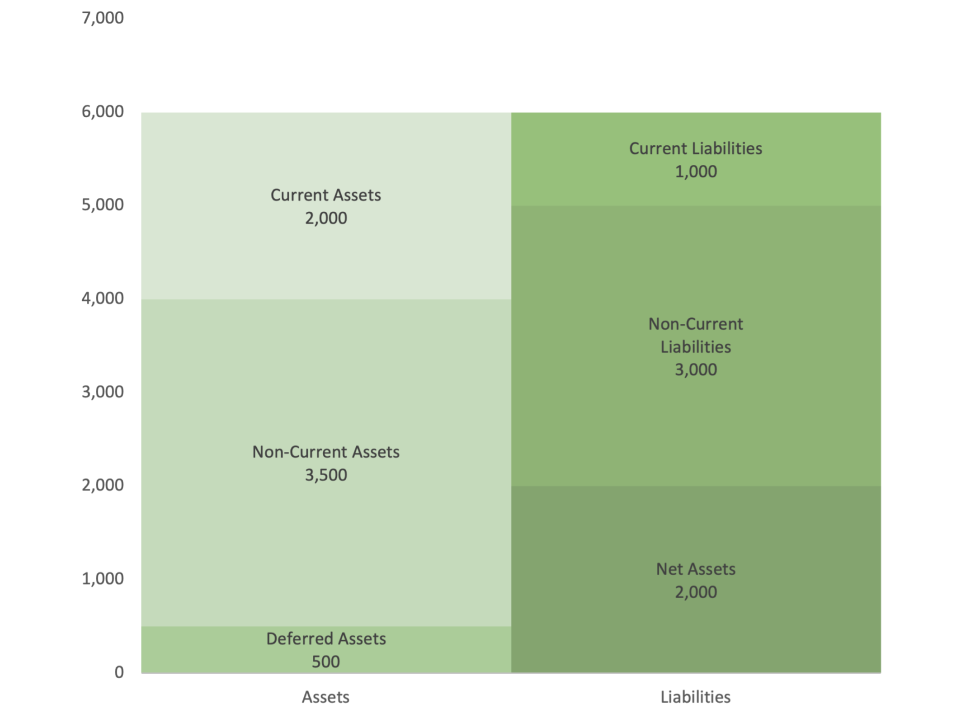
A balance sheet (stacked bar chart) is a visual representation of a company’s financial position, showcasing the distribution of its assets, liabilities, and equity. It uses stacked bar charts to represent the composition and relative proportions of these financial components over time or across different companies. Each bar in the chart represents a specific financial statement, and each segment of the bar represents the values of assets, liabilities, and equity.
-
The primary difference between a stacked bar chart used for a balance sheet and other charts lies in its ability to visually represent the proportional relationships between various financial categories. This unique feature allows stakeholders to quickly grasp the financial health of a company by observing the size and relative composition of each bar, making it easier to understand the balance sheet’s structure.
Applications of Balance Sheet (Stacked Bar Chart)
Comparative Financial Analysis
- A balance sheet (stacked bar chart) is often used for comparative financial analysis. For example, an investor can use this chart to compare the balance sheets of different companies within the same industry, revealing how their asset, liability, and equity structures vary.
Historical Financial Performance
- In analyzing historical financial performance, a stacked bar chart can show how a company’s balance sheet components have evolved over time. For instance, a financial analyst might use this chart to show the year-over-year growth in assets, liabilities, and equity, indicating the company’s financial trends.
Risk Assessment
- In risk assessment, a balance sheet (stacked bar chart) helps evaluate a company’s leverage and liquidity. For example, a bank might use this chart to assess a borrower’s ability to repay loans by analyzing the company’s debt-to-equity ratio over several years.
Mergers and Acquisitions
- In mergers and acquisitions, a stacked bar chart provides insights into the financial health of target companies. For instance, an acquiring company might use this chart to evaluate potential acquisition targets by comparing their balance sheets, helping to make informed decisions.
A balance sheet (stacked bar chart) provides a comprehensive way to visualize a company’s financial position, making it valuable for comparative financial analysis, historical performance analysis, risk assessment, and mergers and acquisitions. Its ability to show the proportional relationships between assets, liabilities, and equity offers valuable insights for strategic decision-making.