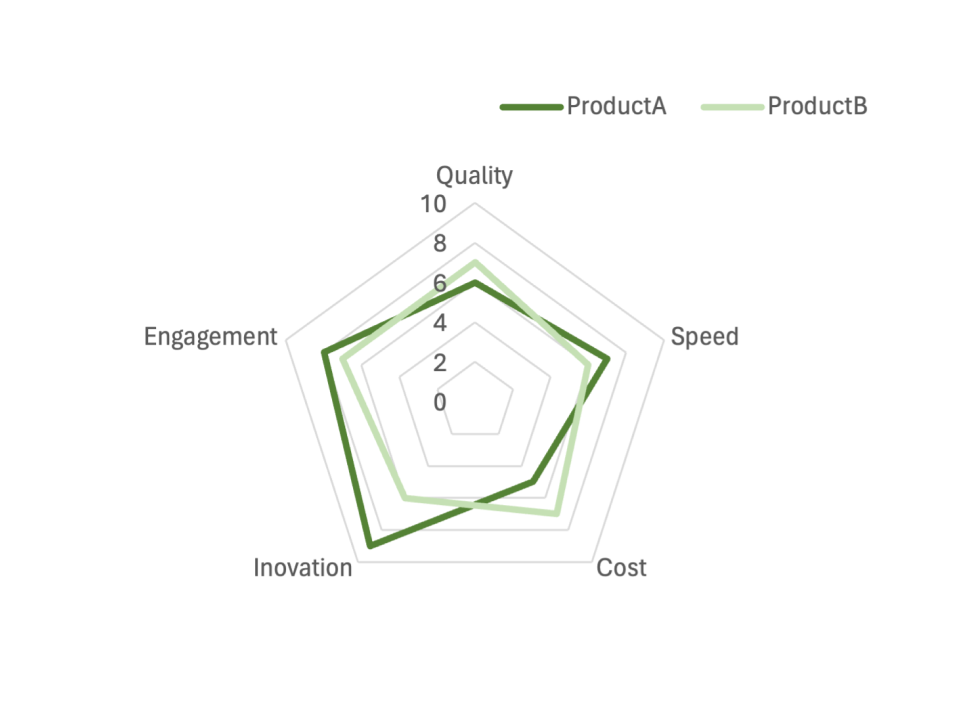
Simple Radar Chart
What is a Radar Chart
-
A radar chart, also known as a spider chart or web chart, is a graphical representation of multivariate data. It consists of a central point from which multiple axes radiate outwards. Each axis represents a different variable, and data values are plotted along each axis, forming a web-like structure. Lines connect the data points around the chart to create a shape that provides a visual representation of how each variable compares.
-
Radar charts differ from other charts like bar charts or line charts because they show the relationship between multiple variables at once, rather than focusing on a single variable’s change over time or across categories. Their unique circular structure allows for a quick comparison of the magnitude and distribution of multiple variables in a compact and intuitive format.
Applications of Radar Charts
Performance Analysis
- Radar charts are often used in performance analysis to compare the strengths and weaknesses of different entities. For instance, a sports coach might use a radar chart to evaluate an athlete’s performance across various skills, such as speed, agility, strength, and endurance.
Competitor Analysis
- In business, radar charts can be used to compare companies across various metrics. For example, a company can use a radar chart to compare its performance against competitors in areas like market share, customer satisfaction, and product innovation, revealing areas for improvement.
Product Feature Comparison
- Radar charts are useful for comparing features of different products. For instance, a technology company might use a radar chart to compare the features of its products against those of competitors, highlighting areas where it excels or falls short.
Employee Skill Assessment
- In HR and personnel management, radar charts help assess employee skills across different competencies. For example, an HR manager could use a radar chart to evaluate employees based on skills such as teamwork, communication, technical expertise, and problem-solving.
Radar charts are powerful tools for comparing multiple variables in a visually compelling way, making them ideal for performance analysis, competitive benchmarking, product comparisons, and skill assessments. Their ability to quickly illustrate complex data relationships enables informed decision-making and strategic planning.
