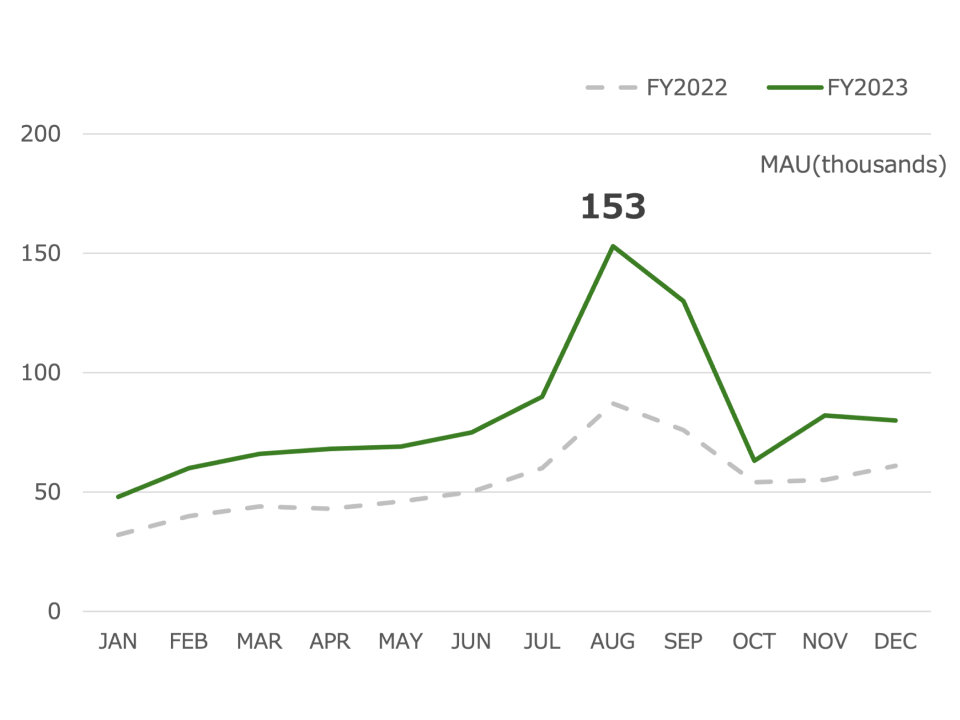
Simple Line Chart
What is a Line Chart
-
A line chart, also known as a line graph, is a type of data visualization used to represent information that changes over time. It consists of a horizontal axis (typically representing time) and a vertical axis (usually representing the data values). Data points are plotted on the graph and connected with a line, illustrating trends and patterns in the data.
-
Line charts differ from other charts, like bar or pie charts, in that they are specifically designed to show trends over time or continuous data. Their unique feature is the ability to display changes and trends across intervals, making them ideal for depicting data that changes sequentially, such as time-series data.
Applications of Line Charts
Stock Price Analysis
- Line charts are frequently used to analyze stock prices, allowing investors to see the trends and fluctuations in the stock market over time. For example, a line chart can depict the closing prices of a stock over several months, revealing trends that inform investment decisions.
Sales Performance Tracking
- In business, line charts are used to track sales performance over different periods. A company might use a line chart to plot monthly sales figures, helping to identify trends and seasonality in sales data that could influence marketing strategies.
Website Traffic Monitoring
- Web analytics teams use line charts to monitor website traffic and user engagement over time. For instance, a line chart can illustrate daily website visits over several weeks, showing trends that indicate the success of online marketing campaigns.
Climate Data Visualization
- In environmental studies, line charts help visualize climate data such as temperature, rainfall, and humidity over time. For example, a meteorologist might use a line chart to show temperature variations over a year, highlighting seasonal patterns and long-term climate changes.
Line charts are versatile tools that can effectively display trends and patterns in data, making them indispensable for stock analysis, business performance, web analytics, and climate studies. Their ability to visualize trends over time allows for insightful analysis and informed decision-making.
