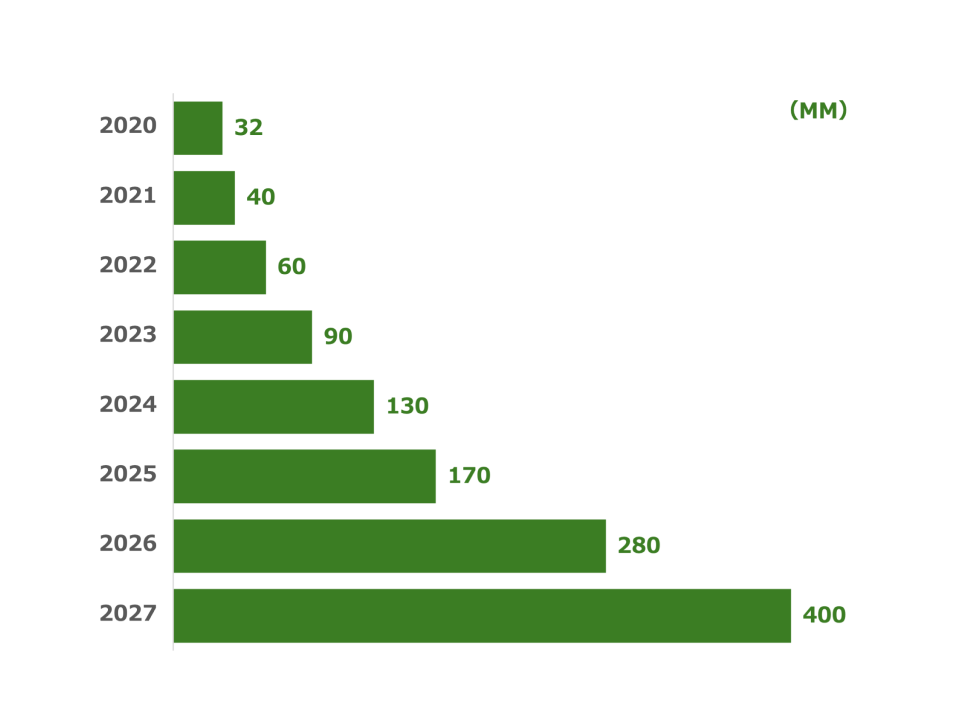
Simple Horizontal Bar Chart
What is a Horizontal Bar Chart
-
A horizontal bar chart is a type of bar chart where the bars are oriented horizontally, representing categories on the vertical axis and data values on the horizontal axis. Each bar’s length is proportional to the value it represents, making it easy to compare data across categories. This chart type is particularly useful for data with long category labels that require more horizontal space for readability.
-
The main difference between a horizontal bar chart and other charts lies in its horizontal orientation, which distinguishes it from the more commonly used vertical bar chart. This orientation allows for better readability when dealing with long category labels and provides an alternative view of data that may otherwise be hard to visualize in a vertical format.
Applications of Horizontal Bar Charts
Survey Results Analysis
- Horizontal bar charts are frequently used in survey analysis to represent the frequency of responses. For instance, a company might use a horizontal bar chart to show customer satisfaction survey results, where each bar represents a different satisfaction level, making it easier to see the distribution of responses.
Project Timeline Management
- In project management, horizontal bar charts are helpful for visualizing timelines. For example, a project manager can use a horizontal bar chart to illustrate the start and end dates of different project phases, providing a clear view of project progress and timelines.
Competitive Market Analysis
- Horizontal bar charts are useful in marketing to compare the market share of different competitors. A horizontal bar chart can illustrate the market share of various companies in a specific industry, with each bar representing a competitor and its corresponding market share percentage.
Budget Allocation Comparison
- Financial analysts use horizontal bar charts to visualize budget allocation across different departments. For instance, a non-profit organization can use a horizontal bar chart to show how the budget is allocated for various initiatives, with each bar representing a different department.
Horizontal bar charts offer a versatile way to compare data across categories, making them ideal for survey analysis, project management, market analysis, and financial planning. Their unique horizontal orientation makes them especially useful for visualizing data with long category labels or detailed timelines.
