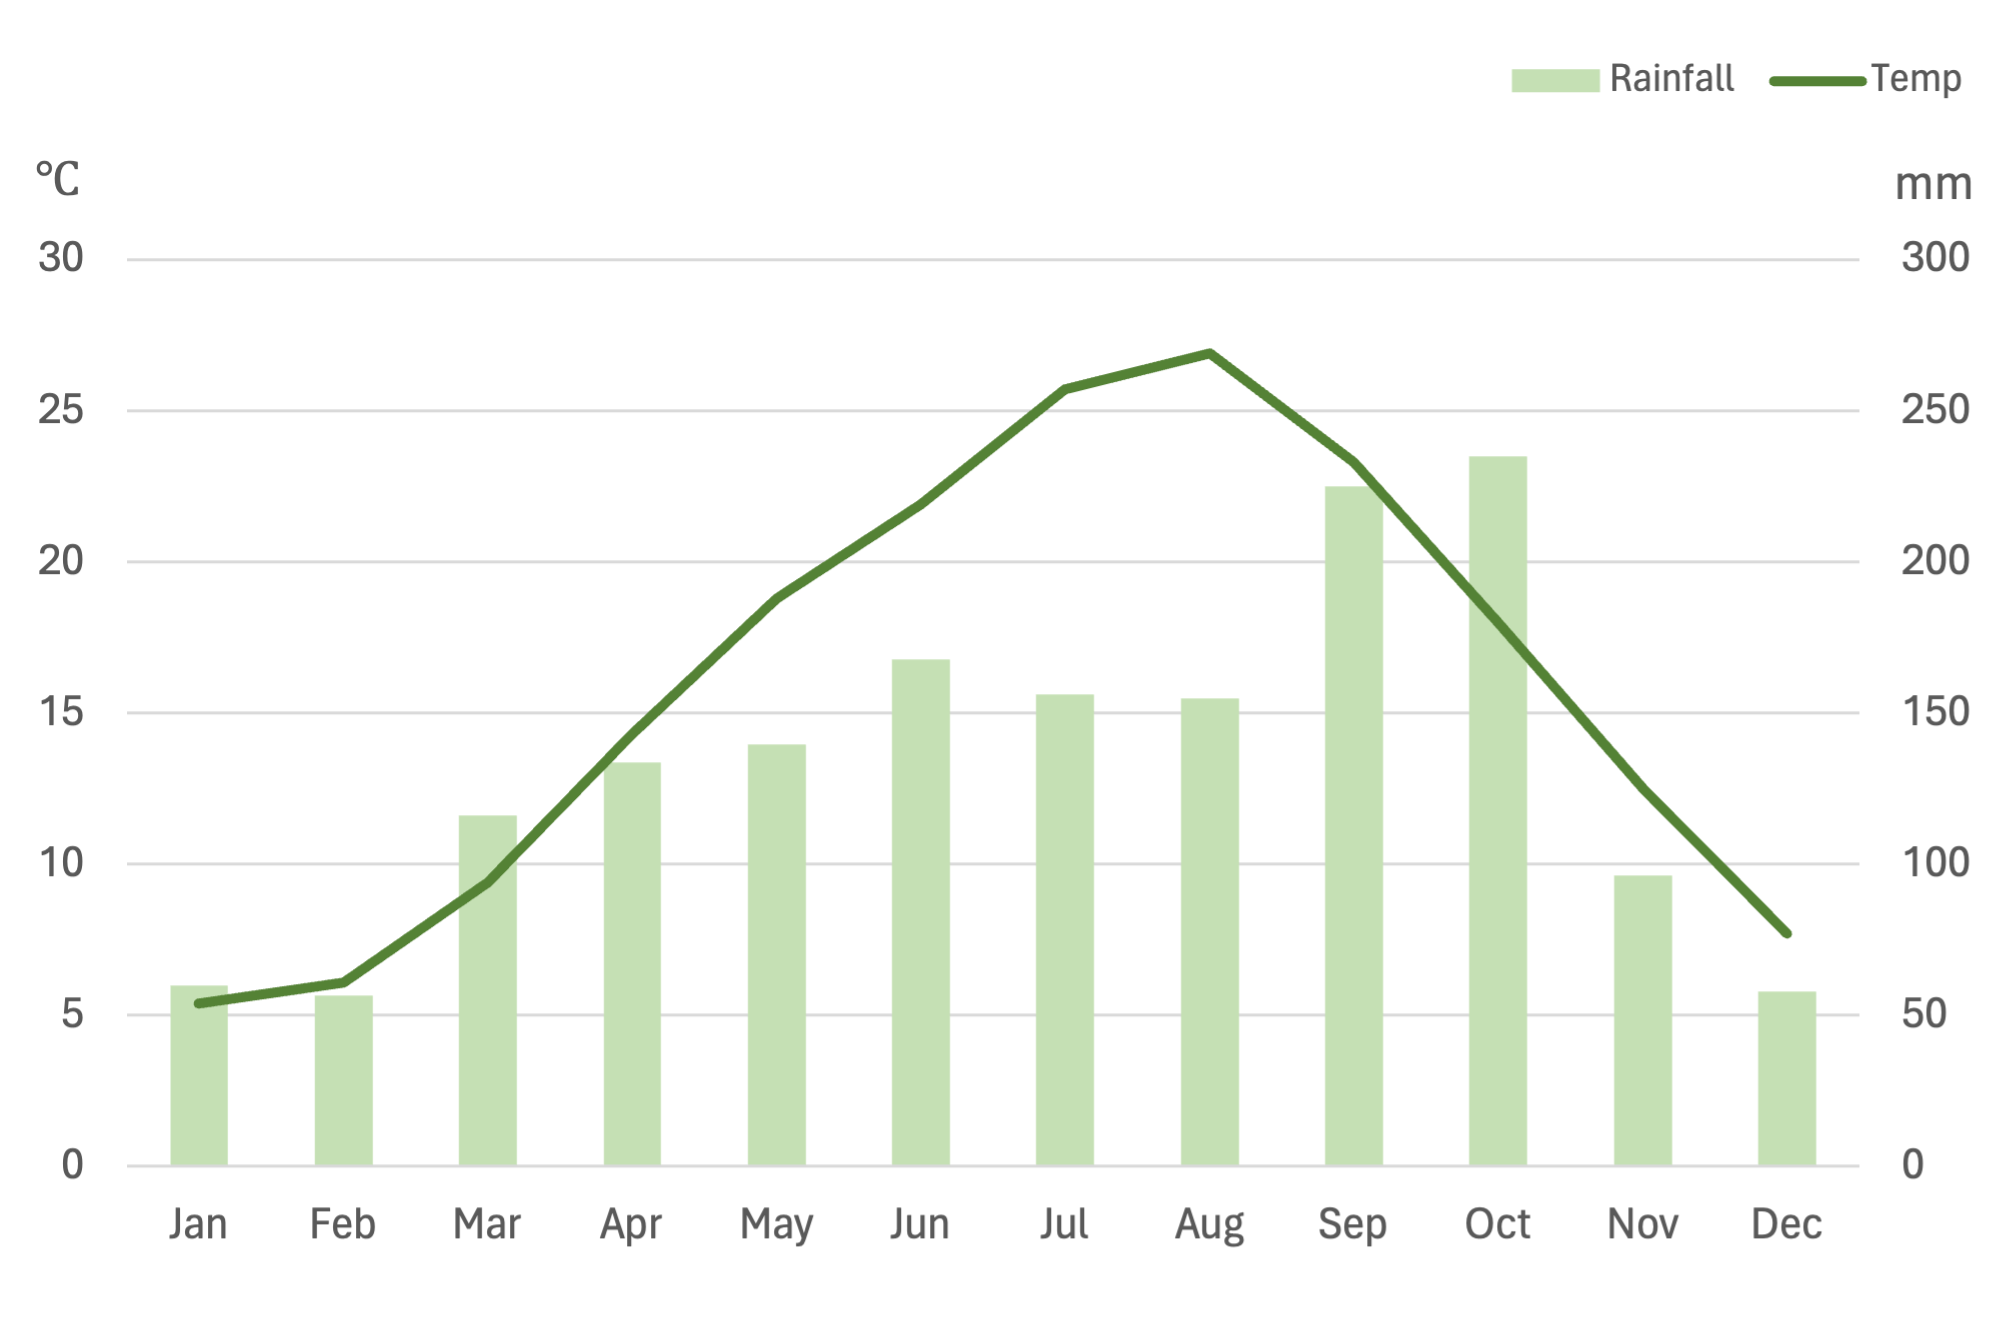
Simple Combo Chart
What is a Combo Chart
-
A combo chart, or combination chart, is a type of data visualization that combines two or more chart types in a single graph to convey information that requires multiple perspectives. Typically, a combo chart includes bar and line charts, where one dataset is represented using bars and another using lines. This dual representation allows for a more comprehensive view of the data by showcasing relationships and comparisons among different datasets.
-
The main difference between a combo chart and other charts lies in its multi-dimensional presentation of data. While traditional bar or line charts focus on a single type of data representation, combo charts merge multiple chart types into one cohesive visual. This unique feature makes them ideal for illustrating relationships between different datasets that might otherwise be challenging to depict.
Applications of Combo Charts
Sales and Profit Analysis
- Combo charts are commonly used in business to analyze the relationship between sales and profits. For instance, a company might use a combo chart to show monthly sales figures using bars, while a line represents the profit margin. This helps visualize how profits vary in relation to sales over time.
Budget vs. Actual Comparison
- In financial analysis, combo charts can be used to compare budgeted and actual spending. For example, a company can use bars to show actual expenses by department and lines to display the budgeted figures. This makes it easy to see where actual spending exceeds or falls short of the budget.
Marketing Campaign Effectiveness
- Marketing teams use combo charts to evaluate campaign effectiveness. For instance, bars can represent the number of impressions generated by different campaigns, while a line shows the conversion rate. This provides insight into which campaigns are most effective at converting leads.
Product Performance Analysis
- Combo charts are useful in analyzing product performance metrics. A retail company could use a combo chart to show the number of units sold for each product using bars, and the corresponding revenue using a line. This allows for easy comparison of product performance.
Combo charts offer a versatile way to present complex data relationships, making them ideal for business analysis, financial management, marketing, and product performance evaluation. Their ability to combine different chart types provides a comprehensive view of data, facilitating better decision-making.
