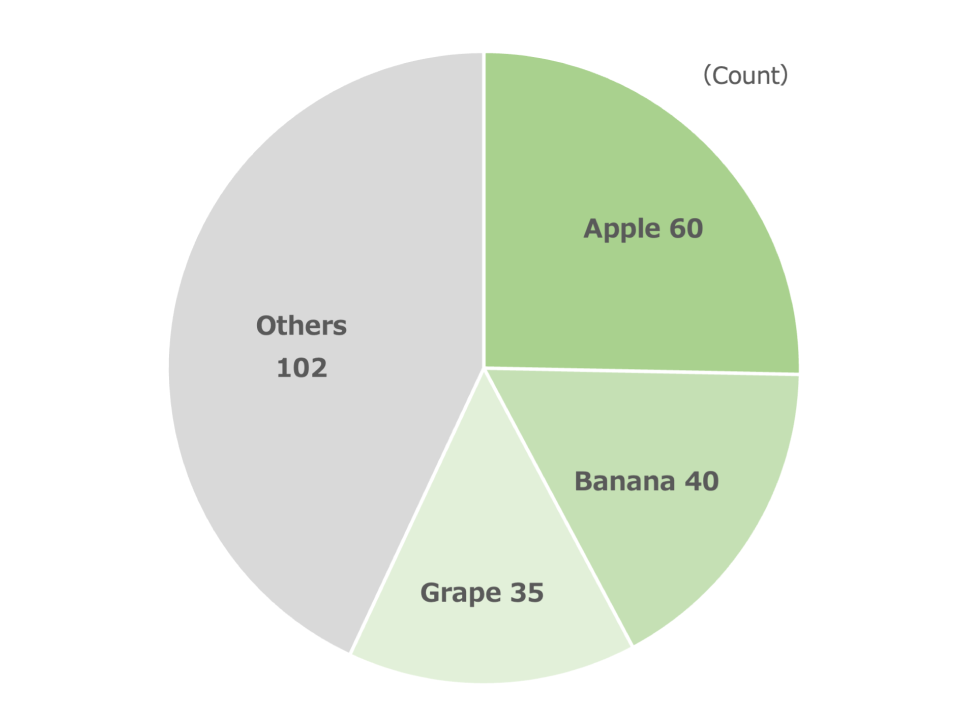
Basic Pie Chart
What is a Bar Chart
-
A bar chart, also known as a bar graph, is a visual representation used to compare different categories of data. It consists of rectangular bars that represent data values, with the length or height of each bar proportionate to the value it represents. The chart typically has two axes: the horizontal axis lists the categories being compared, and the vertical axis shows the numerical values.
-
Bar charts stand out from other charts due to their ability to clearly show comparisons among different data sets. While line charts are better for showing trends over time, bar charts excel in presenting categorical comparisons. Their structure allows for easy visual analysis of differences in data, making them particularly useful for showing rankings or distributions.
Applications of Bar Charts
Product Sales Analysis
- Bar charts are widely used to analyze sales data for products, services, or regions. For example, a company can use a bar chart to compare the monthly sales figures of different products, revealing trends and enabling strategic business decisions.
Market Research Surveys
- In market research, bar charts help illustrate survey results, such as customer satisfaction levels or brand awareness. For instance, a survey could use a bar chart to display the number of respondents preferring different brands, providing clear insights for marketers.
Budget Allocation Comparison
- Bar charts are effective in visualizing budget allocation across various departments or projects. For example, a finance team might use a bar chart to present the annual budget distribution among departments, making it easier to identify areas with high or low funding.
Population Distribution Analysis
- Bar charts are valuable for visualizing demographic data, like population distribution across age groups or regions. For instance, a government report might use a bar chart to display the population distribution by age, highlighting the demographic trends of different age groups.
Bar charts are versatile tools for comparing data across various categories, making them useful in business analysis, research, and reporting. Their clarity and simplicity allow for quick and effective data understanding.
