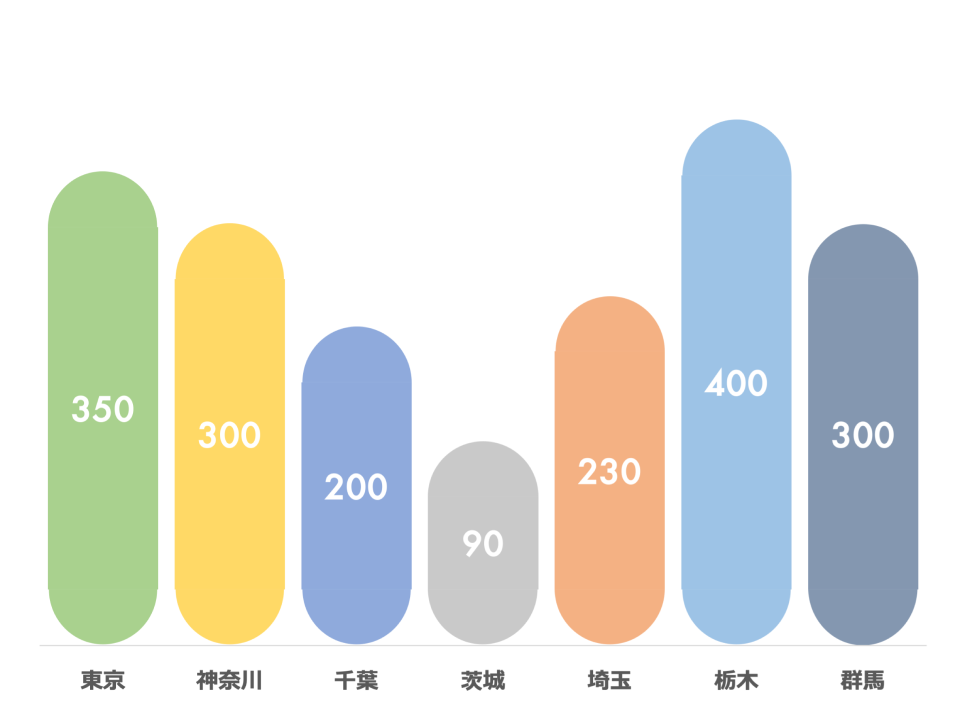
Rounded Bar Chart
What is a Rounded Bar Chart
-
A rounded bar chart is a variation of the traditional bar chart where the ends of the bars are rounded rather than having the usual square or rectangular ends. This subtle design difference enhances the visual appeal of the chart, making it look softer and more modern while maintaining the basic structure of a standard bar chart. Rounded bar charts still display data using bars to represent the magnitude of values for different categories.
-
The primary distinction between a rounded bar chart and other charts is its design aesthetic. The rounded ends provide a unique look that helps distinguish it from standard bar charts and other types of charts. Despite this visual modification, it retains the fundamental advantage of bar charts: comparing categorical data effectively.
Applications of Rounded Bar Charts
Sales and Revenue Analysis
- Rounded bar charts are commonly used in sales and revenue analysis, where aesthetics are essential for presentations to clients or stakeholders. For instance, a marketing team can use a rounded bar chart to present sales data for different products, adding a visual edge to the report.
Social Media Analytics
- For social media performance analytics, rounded bar charts provide a visually appealing way to represent data such as follower growth, engagement metrics, or post reach. For example, a social media manager could use a rounded bar chart to show the month-over-month increase in followers on various platforms.
Survey Results Presentation
- Rounded bar charts are excellent for presenting survey results, where clarity and aesthetics are important. For instance, a market research firm could use these charts to display customer satisfaction levels across different demographics, offering a visually striking way to convey insights.
Project Milestone Tracking
- Rounded bar charts are also useful in project management for tracking milestones and progress in a visually appealing way. For example, a project manager can use a rounded bar chart to represent the completion percentage of various project phases, making project tracking more engaging for stakeholders.
Rounded bar charts combine the functional clarity of traditional bar charts with an enhanced visual design, making them suitable for applications where aesthetics and data comprehension are equally important.
